| NAVAL ORDNANCE AND GUNNERY VOLUME 2, FIRE CONTROL CHAPTER 19 SURFACE FIRE CONTROL PROBLEM |
| HOME INDEX Chapter 19 SURFACE FIRE CONTROL PROBLEM A. General B. Analytical solution C. Graphic rangekeeping D. Mechanical solution-general E. Basic mechanisms F. Mechanical solution-basic rangekeepers G. Mechanical solution-establishing the horizontal plane |
| C. Graphic Rangekeeping 19C1. The Mark 2 plotting board In the analytical solution (sec. 19B), target motion and own-ship motion in the LOS were calculated mathematically and combined into range rate. The same range rate may be determined by graphic analysis. |
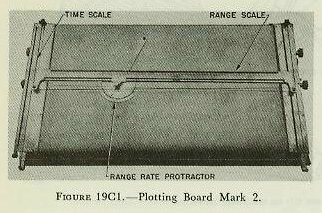 |
| In 1911, the Mark 2 plotting board (fig. l9Cl) was introduced and became an important part of the main-battery fire control system. In modern fire control systems the functions of the plotting board are performed by rangekeepers and their automatic graphic plotters. However, an explanation of the operation of the plotting board at this time will serve to demonstrate the fundamentals of all graphic rangekeeping. The plotting board was designed to keep present range and to predict range for short intervals. It also provided a means of determining range rate and sight-bar range. It still is used to furnish a convenient method of keeping a time record of the firing, including deflection settings, spots applied, and times of salvos. This record is invaluable for post-firing analysis. |
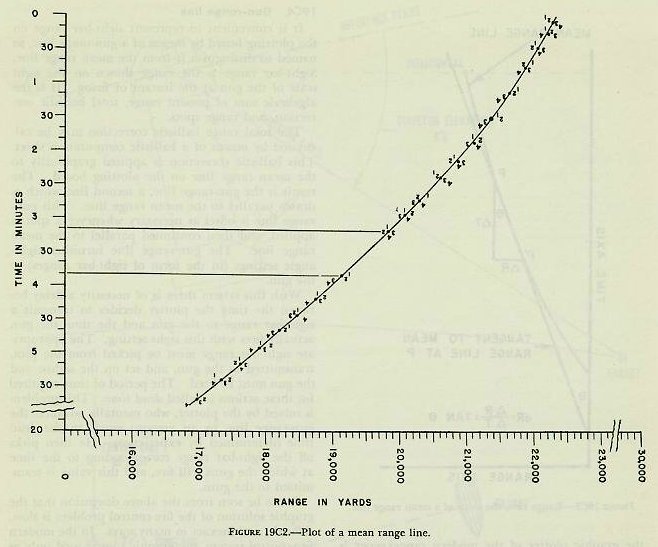
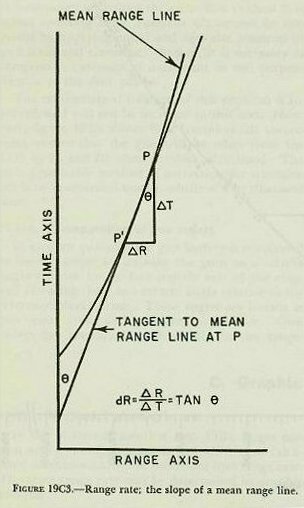
| 19C2. Principle of graphic plotting If range is plotted against time, a series of points will be developed which may be connected to form a curve. If the points represent the mean of the ranges of several rangefinding instruments (as in fig. 19C2), the resulting curve is known as the mean range line. This is a graphic means of keeping the range. Referring to figure 19C1, the range scale is moved downward at a fixed time rate. Ranges plotted along the range scale provide the points which are connected to form the mean range line. If ranging is interrupted for a short interval of time, the mean range line may be continued (or advanced) with little or no loss in accuracy. This has occurred from 3 minutes 10 seconds to 3 minutes 50 seconds in figure 19C2. 19C3. Range rate An inspection of figure 19C2 reveals that if the mean range line slopes downward to the left, as in this case, the range is decreasing. The result is a decreasing or negative range rate. Conversely, if the mean range line were sloping downward to the right, the range rate would be increasing or positive. The amount of slope at any point with respect to the time axis is a direct indication of the instant range rate at that time. More accurately stated, range rate varies directly as the tangent of the angle formed by a line tangent to the mean range line and the vertical (time axis). This is illustrated in figure 19C3. |
 |
 |
 |
| Range rate determined in a similar manner on the graphic plotter of the modern rangekeeper is used to check the range rate generated by the range-keeper. This will be explained in chapter 20. 19C4. Gun-range line It is convenient to represent sight-bar range on the plotting board by means of a gun-range line, so named to distinguish it from the mean range line. Sight-bar range is the range shown on the sight scale of the gun at the instant of firing. It is the algebraic sum of present range, total ballistic correction, and range spots. The total range ballistic correction may be calculated by means of a ballistic computation sheet. This ballistic correction is applied graphically to the mean range line on the plotting board. The result is the gun-range line, a second line which is drawn parallel to the mean range line. This gun-range line is offset as necessary whenever a spot is applied, and then continued parallel to the mean range line. The gun-range line furnishes sight-angle settings (in the form of sight-bar ranges) to the gun. With this system there is of necessity a delay between the time the plotter decides to transmit a sight-bar range to the gun and the time the gun actually fires with this sight setting. The appropriate sight-bar range must be picked from the plot, transmitted to the gun, and set on the sights; and the gun must be fired. The period of time required for these actions is called dead time. This problem is solved by the plotter, who mentally advances the gun-range line by an amount equal to the dead time (determined by experience). He then picks off the sight-bar range corresponding to the time at which the guns will fire, and this value is transmitted to the guns. It can be seen from the above discussion that the graphic solution of the fire-control problem is slow, difficult, and inexact in many ways. In the modern fire-control system, the graphic plot is used only as a check on the range rate generated by the range-keeper. |